Mobile Based Blood Analysis
Google Summer of Code, 2016Abdul Fatir Ansari with Computational Biology @ University of Nebraska-Lincoln
Introduction
The aim of this project is to use the camera and processing power of modern day cell phones to develop an intuitive and user-friendly application for the detection and concentration estimation of various bio-markers in blood sample images. It is later planned to be used as a screening test for cancer. The application will allow the user to take images of the blood samples in a set format. The image will then be segmented to detect the regions of interest. After noise removal, the intensity of each individual blob will be calculated. A linear curve will be fit through the intensity and known concentration data and the concentrations of the unknown samples will be estimated from the standard curve which will quantify the various molecules present in the sample.
Demo
A video showing entire usage flow of the final Android Application with both demo mode on and off is exhibited below.
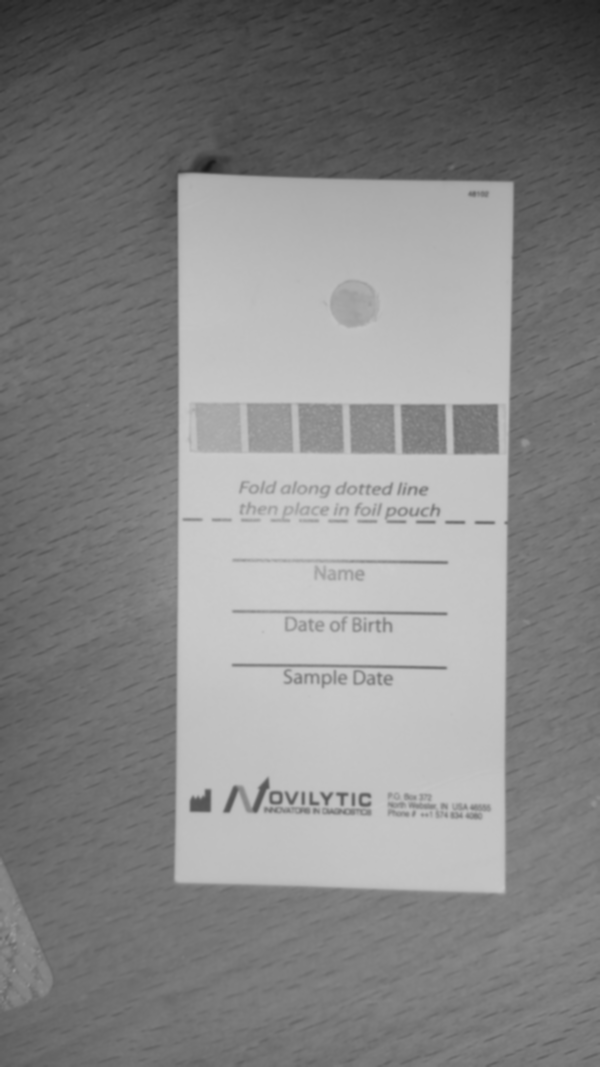
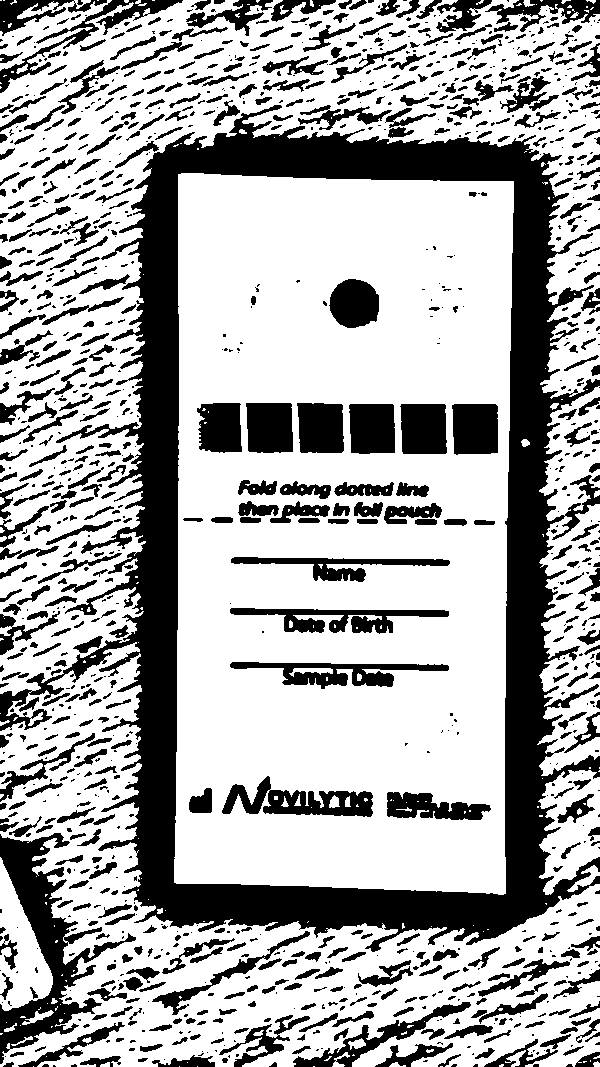
The algorithm developed for detection is fairly robust. We tested it against images of very bad quality, taken in bad lighting and it performed well. Here is a video showing the robustness of detection using our algorithm.
Sources
This project has been created from scratch and the sources for Android Studio can be found in this repository. A list of commits can be found here.
How to Build
- Clone the repository or download it as a zip file and extract it.
- Open Android Studio and import the directory as an existing Android project.
Usage
Android Phone
- On your Android phone go to Settings > Security and Allow installation of apps from unknown sources.
- Download and Install ConcAnalyzerv1.1.apk from here on your phone.
- On first run, you'll be prompted whether to keep demo mode on.
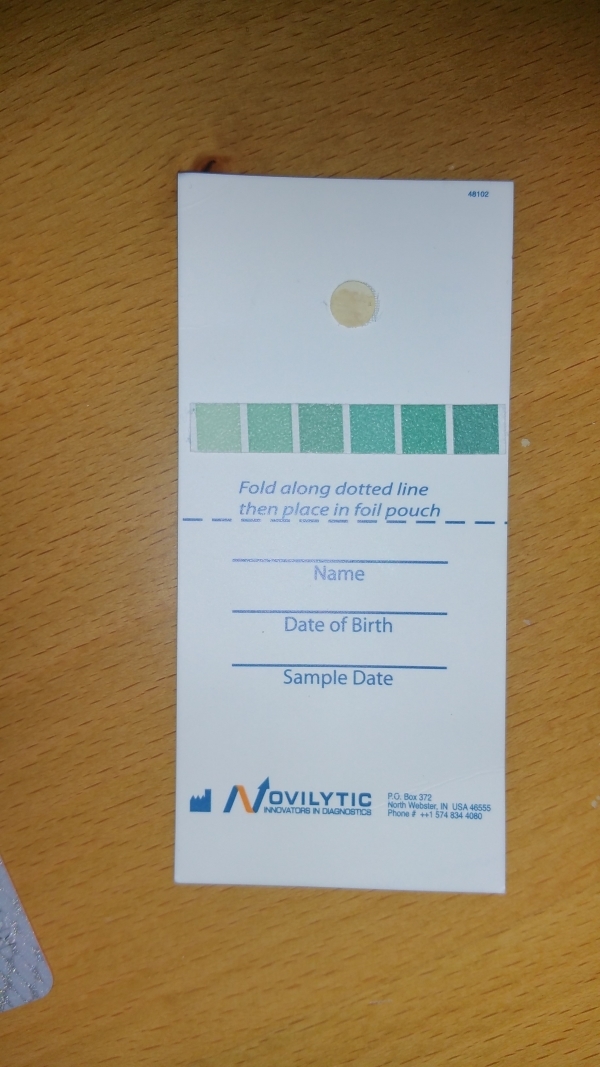
- Choose Load Image option and open image of the card with blood sample from your phone's Gallery (local storage). Images of this dataset can be used. To be able to use the Take Picture option, you need to have a physical test card. You can get a printout of one of these images and use it instead for testing. When taking a picture, keep the background distraction-less (white preferably).
- Make sure that the image is loaded in portrait orientation. Rotate if necessary. It should be loaded like this and not like this. Check Known Issues.
- Tap on Analyze. If the analysis is successful, the detected regions of interest will be highlighted using green color. If the demo mode is on, the detected regions will be highlighted in red. A red highlight indicates that the details for that blob have been updated.
- If the demo mode is off, tap on each detected blob to enter its details. Once the details are entered for a blob, its highlight will turn red. Concentrations of Standard and Quality Control samples are given below.
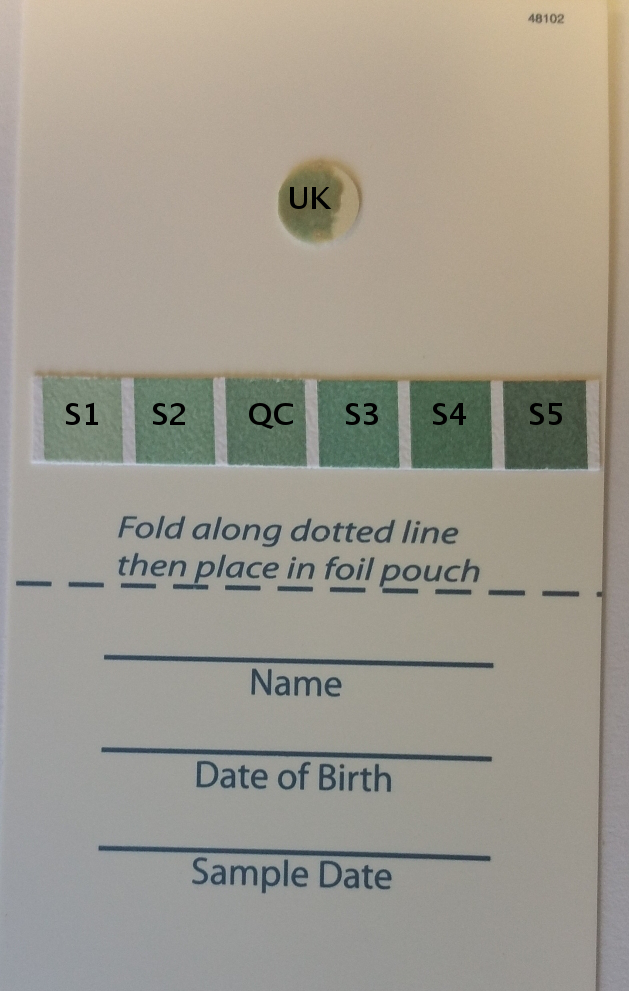
S1, S2, S3, S4, S5: Standard Samples, QC: Quality Control Sample, UK: Unknown SampleSample Name Concentration (ng/mL) S1 100 S2 150 S3 250 S4 300 S5 350 QC 200 - Tap on Results and the estimated concentration of the unknown sample will be shown along with the standard curve. A message will be shown if the error in the calculation of the concentration of the quality control sample exceeds 20%.
Note: The application has been tested on Android versions 5.0, 5.1, and 6.0 on Samsung, Moto and Xiaomi phones. The application may or may not work properly on pre-Lollipop Android devices.
Details of the Algorithm Used
- Let \(I_{raw}\) be the original image of the test card in portrait scaled to a width of 600 while maintaining the aspect ratio.
\(I_{raw}\) : The Raw Image - Convert \(I_{raw}\) to grayscale to get \(I_{gray}\).

\(I_{gray}\) : The Raw Image in Grayscale - Apply 5x5 Gaussian Blur to \(I_{gray}\) to get \(I_{gb}\).
\(I_{gb}\) : Gaussian Blurred \(I_{gray}\) - Apply Adaptive Threshold to \(I_{gb}\) with a block-size of 85, C-value of 2 and method MEAN_C to get a binary image \(I_{th}\).
\(I_{th}\) : \(I_{gb}\) after Adaptive Threshold - Apply morphological closing to \(I_{th}\) using a rectangular structuring element of size 15x15 to get \(I_{mo}\).
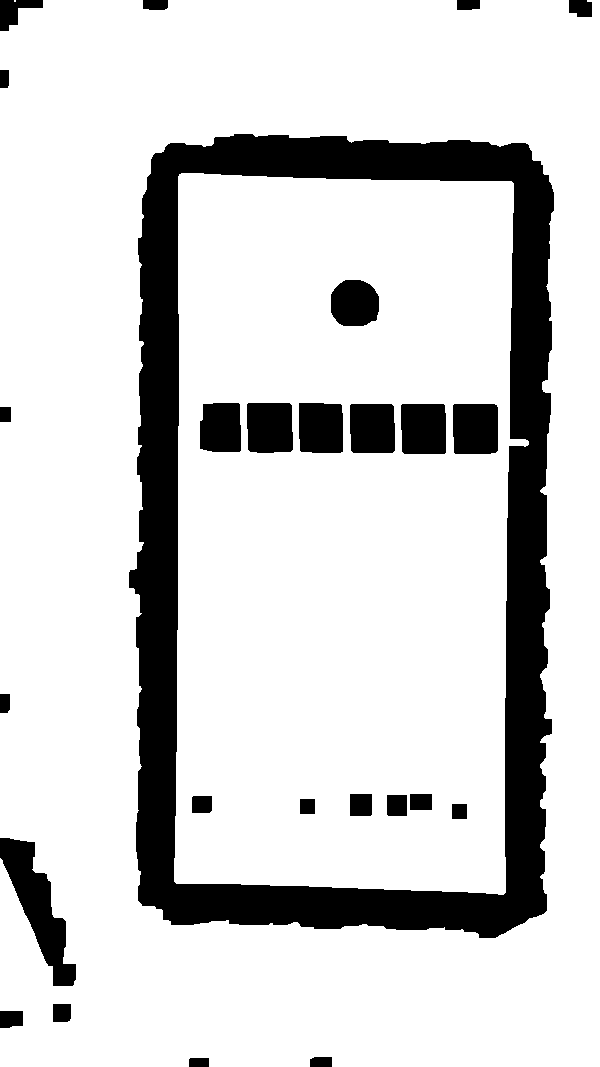
\(I_{mo}\) : \(I_{th}\) after Morphological Closing - Find the contours in \(I_{mo}\) and filter the found contours based on following criteria.
- Area bounded by the contour lies between 1000 and 16000.
- Aspect ratio of the rectangle bounding the contour lies between 1 and 1.5.
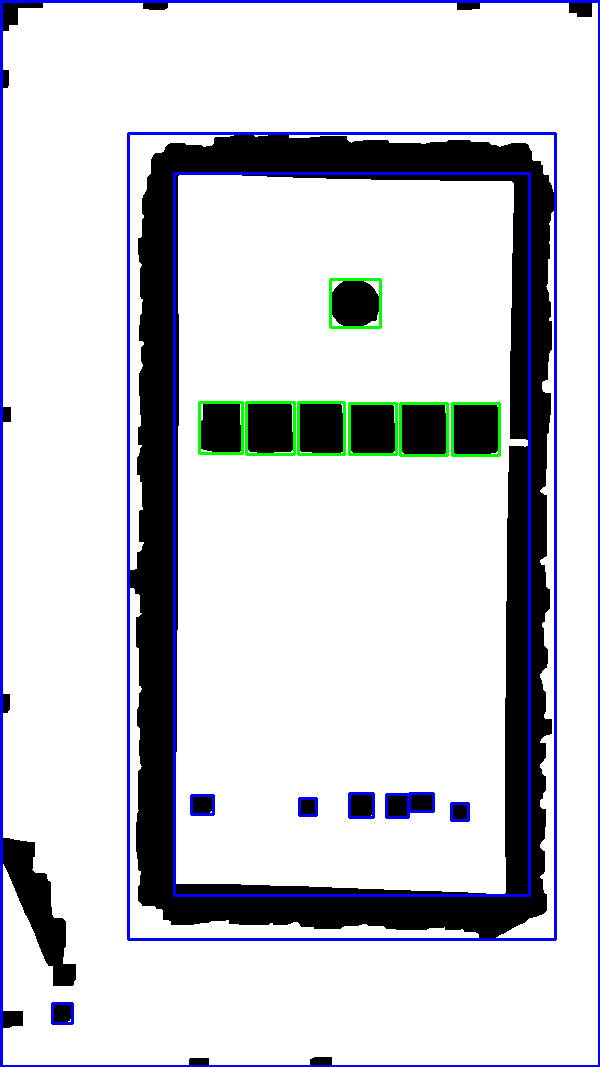
Green and Blue boxes represent contours satisfying and not satisfying the set criteria respectively - Find the co-ordinates of center of all rectangles bounding these filtered contours.
- Check the number of rectangular regions which lie within \(\pm15\) pixels in \(Y\) direction. If exactly 6 such regions are found, the algorithm proceeds. These six regions represent the standard and quality control samples.
- Find another blob whose center is at least 20 pixels away from the centers of the standard samples in the \(Y\) direction and lies approximately in the horizontal center of the 6 blobs.
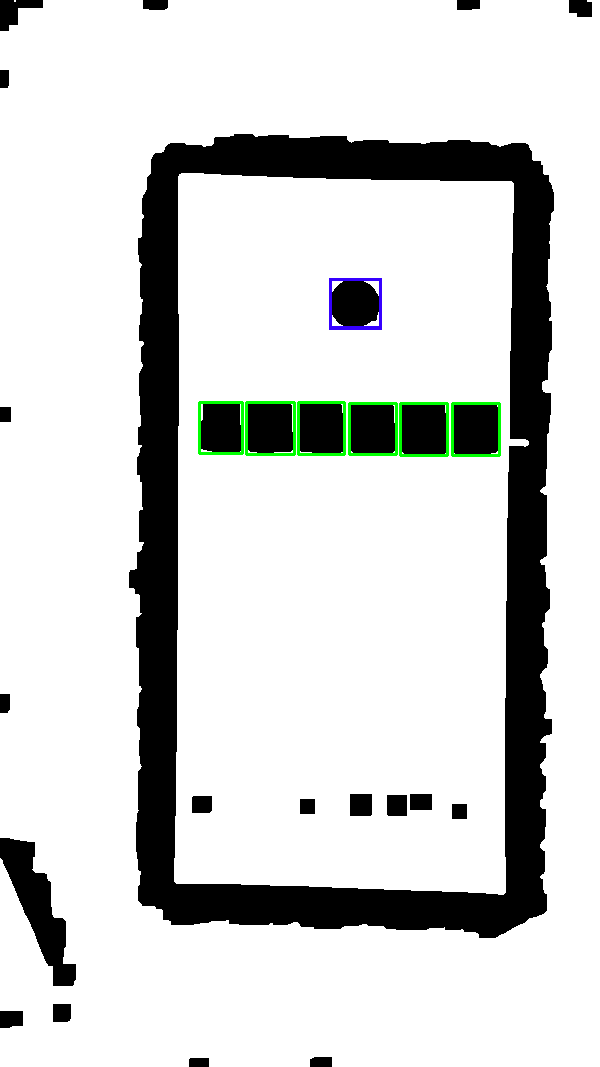
The Final Detections. Green: Standard and Quality Control samples, Blue: Unknown sample. -
For each blob \(B\) of the 7 blobs.
- Clip the rectangular portion bounding \(B\) from \(I_{gray}\) to get \(R_{gray}\).
- Apply Otsu's binarization to \(R_{gray}\) to get \(R_{th}\).
- Iterate over every pixel of \(R_{gray}\) and sum the intensities of all pixels where \(R_{th}\) is 0. Let the sum be \(S\).
- Calculate average \(A = S/N\) where is \(N\) is the number of pixels in \(R_{th}\) with value 0.
- Using the average intensity values and known concentration values of the five standard samples to train a linear regression model to get slope and intercept of the curve.
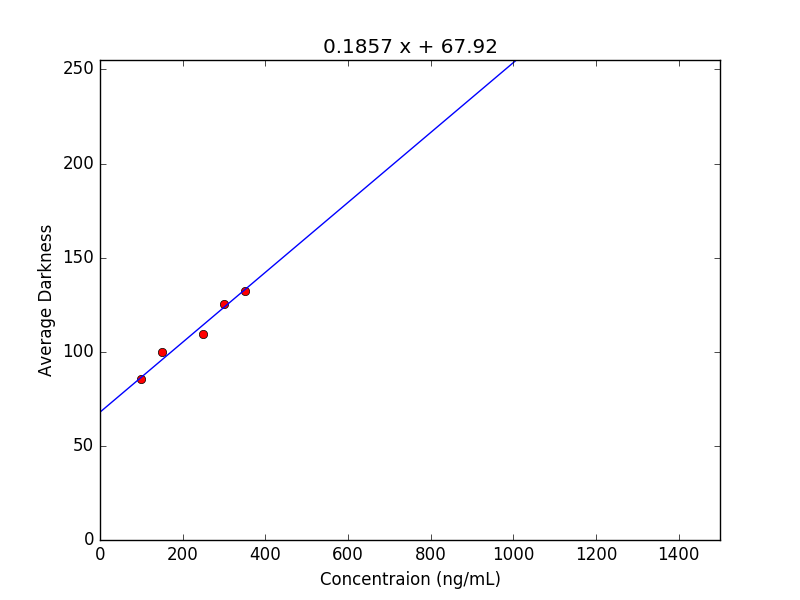
The Linear Regression - Calculate the concentration of the quality control and unknown samples using the slope and intercept values.
- Check if the calculated concentration value of quality control sample lies within 20% error bound.
Known Issues
- In some Samsung and Mi phones, at times the image taken from the camera is rotated after capture. For the application to function, the test card should be loaded in portrait orientation like this, and not in landscape. Therefore, when using the camera feature, the picture should be taken such that it loads as a portrait image.
Acknowledgment
I'm indebted to Dr. Tomas Helikar for giving me the opportunity of working on this amazing project. I would also like to thank Philipp Jahoda, whose library, MPAndroidChart, has been used in this project. It has been released under Apache License 2.0.
Also, Thank you, Google. :D